Blog·
What a land use mix score tells a site selection analyst
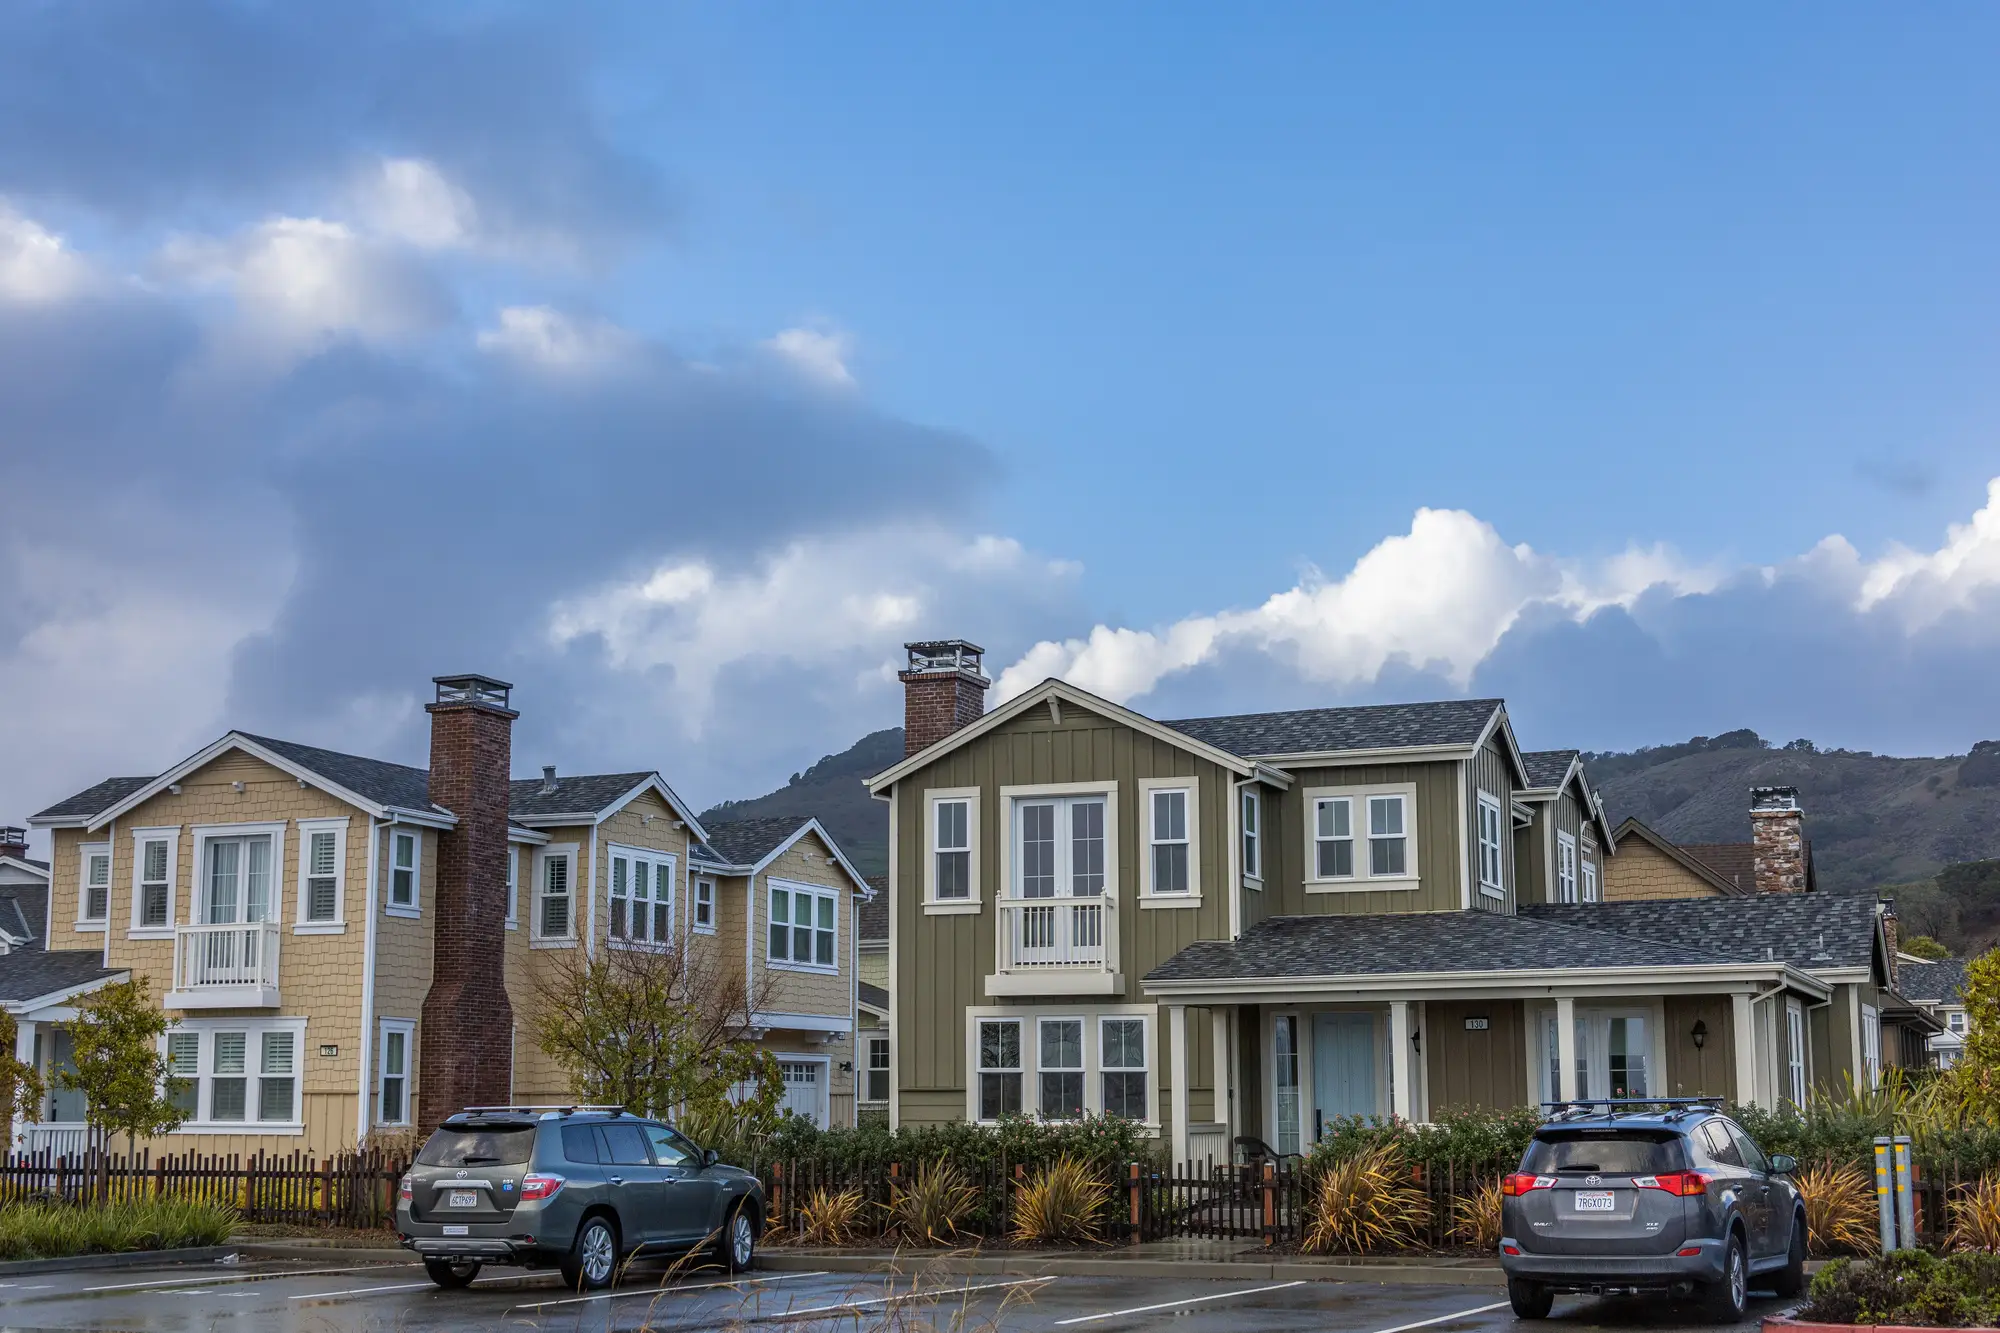
A land use mix score is a shorthand number (or short breakdown) for how a parcel's surrounding half-mile or mile is built out: how much is single-family, how much is multifamily, how much is commercial strip, how much is still vacant or agricultural. Some teams score it as a single index. Most just want the percentages themselves, because a score alone can hide the difference between 60% single-family rowhomes and 60% garden apartments, and those two trade areas spend very differently.
Analysts reach for this because a demographic report can post a healthy median household income and population density for a trade area that's really two different places depending on where that density sits. A trade area posting $78,000 median income and 4,200 people per square mile could be three-story walkups within a half mile of the site, or quarter-acre lots two miles out, and the census pull alone won't say which. Built form is what drives walk-in traffic, drive time tolerance, and whether a format that needs a big parking field even fits the context.
Why land use breakdown matters more than the pin count
Most retail site selection workflows start with a demographic pull and a competitor map, then layer in traffic counts. Land use breakdown is the piece that usually gets skipped, mostly because getting it has meant pulling assessor parcel data county by county, which doesn't exist in a clean format everywhere and definitely doesn't come in a consistent schema from one jurisdiction to the next. So a lot of site packets just don't have it, and the gap gets filled with judgment calls from whoever drove the site last.
That's a real cost. A site with the right rooftop count on paper can still be surrounded by land that's zoned residential but functionally vacant, or by a housing stock that's aging out and converting to rental, or by a strip of underused commercial parcels that are about to get redeveloped into something denser. None of that shows up in a standard demographic report. It shows up when you look at what's actually built.
Housing type mix in a trade area, read from imagery
Housing type mix is the other half of the picture, and it's the part that's hardest to get from any existing dataset. Single-family detached, townhome, garden apartment, high-rise, and manufactured housing all produce different household formation, car ownership, and trip frequency patterns, even at the same income level. A trade area that's 70% single-family detached behaves differently at the register than one that's 70% mid-rise multifamily, and most of the datasets site selection teams already license weren't built to tell those apart at the parcel level.
This is the gap Trade Area Profiling fills. Instead of waiting on assessor exports or sending someone to drive the ring, you ask for a read of the high-res imagery around the candidate site, and you get back a numbered brief: housing type mix, density, and land use breakdown for that specific trade area, on the schedule you set, not a quarterly refresh you have to wait on. You can see how the brief is built and what's in it before you decide whether it fits the next round of site packets.
Where this fits in a site selection workflow
The land use read sits next to the demographic pull and the trade area sales forecast, catching the cases where the numbers and the built form don't line up. If the forecast says a site should perform like your top-quartile stores but the land use breakdown shows a trade area half as dense as those comparables and heavier on single-family than your model assumes, that's worth a second look before the site goes to committee. If two candidate sites look identical on income and population but one sits in a trade area that's mostly garden apartments within a mile and the other is mostly large-lot single-family, that difference belongs in the packet, not just in someone's memory of the drive.
Used that way, a land use mix score, or the unscored breakdown behind it, earns its place in the site selection process the same way a traffic count does: one more read of ground truth, pulled from what's standing on the parcel rather than inferred from a block group average. Request a brief for your next candidate site and see what the built form looks like before it goes to committee.