Blog·
Reading housing mix when your radius doesn't match the census tract
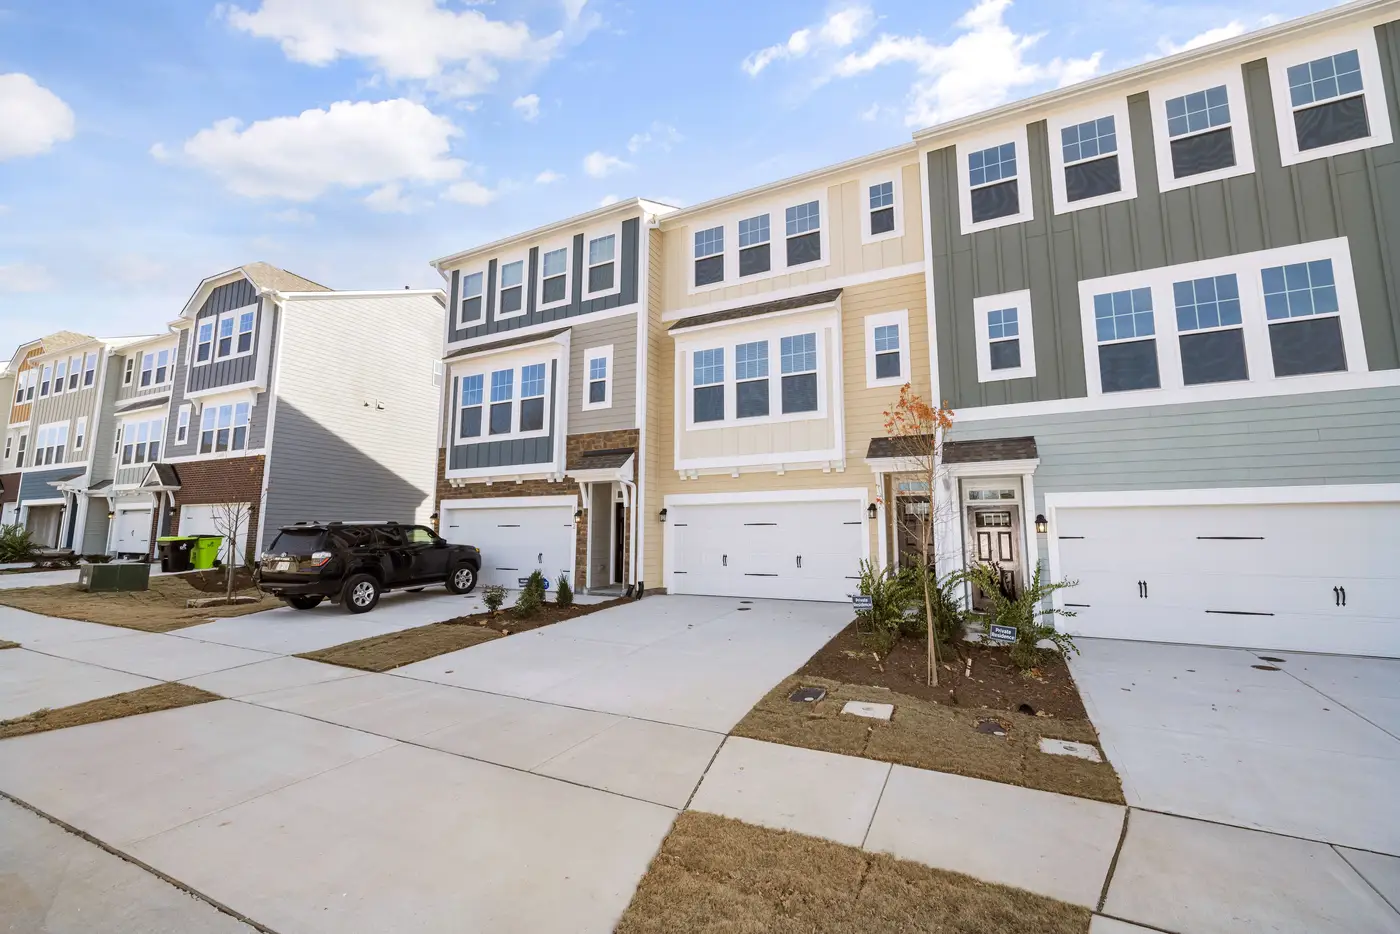
You pull a 3-mile drive-time ring around a candidate site, and it crosses seven census tracts. Four of them are fully inside the ring. Three are clipped at the edge, maybe 20% in and 80% out. Your demographic vendor hands you tract-level housing data: unit counts, owner-occupied share, multifamily percentage, all of it reported at the tract centroid or the tract total. Now you're supposed to say what the housing mix looks like inside that ring.
This is the apportionment problem, and anyone who's built a trade area report has run into it. The Census Bureau draws tracts to hit a population target, roughly 1,200 to 8,000 people, not to match how people drive to a store. Your ring is a drive-time polygon or a radius buffer. The tract is a different shape entirely, drawn for a different purpose, updated on a different clock. They were never going to line up.
Why tracts and rings never line up
A tract boundary follows roads, rivers, and sometimes old survey lines that haven't mattered since the 1990s. A drive-time ring follows travel time on the current road network. Put those two shapes on top of each other and you get partial overlaps everywhere except in the rare case where a tract happens to sit entirely inside or entirely outside your ring.
The standard fix is areal interpolation: you take the percentage of a tract's land area that falls inside your ring and apply that same percentage to the tract's housing counts. If 35% of a tract's area is inside the ring, you assume 35% of its housing units are too.
That assumption breaks constantly. A tract might be 80% vacant land or a golf course, with every house packed into the 20% sliver nearest the ring's edge, or furthest from it. Apportioning by land area assumes housing is spread evenly across the tract, and it almost never is. Multifamily buildings cluster along the corridor. Single-family subdivisions sit behind them. A land-area split can hand you a housing mix that bears no relationship to what's built on the ground.
Three ways analysts patch the gap
Most site selection teams handle this one of three ways.
Weighted interpolation using a proxy variable is the common upgrade: instead of splitting by raw land area, you split by developed land, or by daytime population, or by addresses pulled from a parcel file. It's better than straight area-weighting, but it's still an estimate built on a stand-in variable, not an observation of the housing itself.
Block-group-level data instead of tract-level is another route. Block groups are smaller, so the mismatch shrinks, but it doesn't disappear, and not every variable you need is published below the tract level. You trade one kind of imprecision for a narrower version of the same problem.
The third option, when the ring really matters, is to just go look. Pull up high-resolution imagery of the ring and read the housing stock directly: single-family detached, townhomes, garden apartments, mid-rise, how dense the parcels are, what share of the visible land is residential versus commercial versus still vacant. This gives you a direct read of what's built inside the boundary you drew, instead of an estimate apportioned from a tract that only partly overlaps it.
That's a slower process by hand, pulling imagery tile by tile and categorizing lots, which is part of why most teams default to interpolation and accept the error bars. It's also the gap Trade Area Profiling is built to close: a numbered brief for a specific candidate site that reads the imagery inside your actual radius or drive-time ring and reports housing type mix, density, and land use breakdown for that shape, not for the nearest tract approximation of it.
What to do with this when you can't commission a full read
If you're stuck with tract-level apportionment for now, document the method. Note which variable you weighted by, land area or something else, so the next analyst (or the next version of you, six months later) knows why the housing mix number is an estimate and not a count. Flag any tract in your ring where the overlap is under 30% or over 70%, since those are the ones where the area-weighting assumption is most likely to be wrong in either direction.
The mismatch between tract boundaries and radius or drive-time rings is structural: the two shapes get drawn for entirely different purposes, on different clocks, for different ends. Knowing that, a site selection analyst can decide where the estimate is reliable enough to run with and where it's worth pulling a direct read of what's sitting in the ring.
If you've got a candidate site where the tract-level guess isn't good enough, request a profile and see what's actually built inside your radius.