Blog·
How to estimate rooftop count in a trade area without parcel data
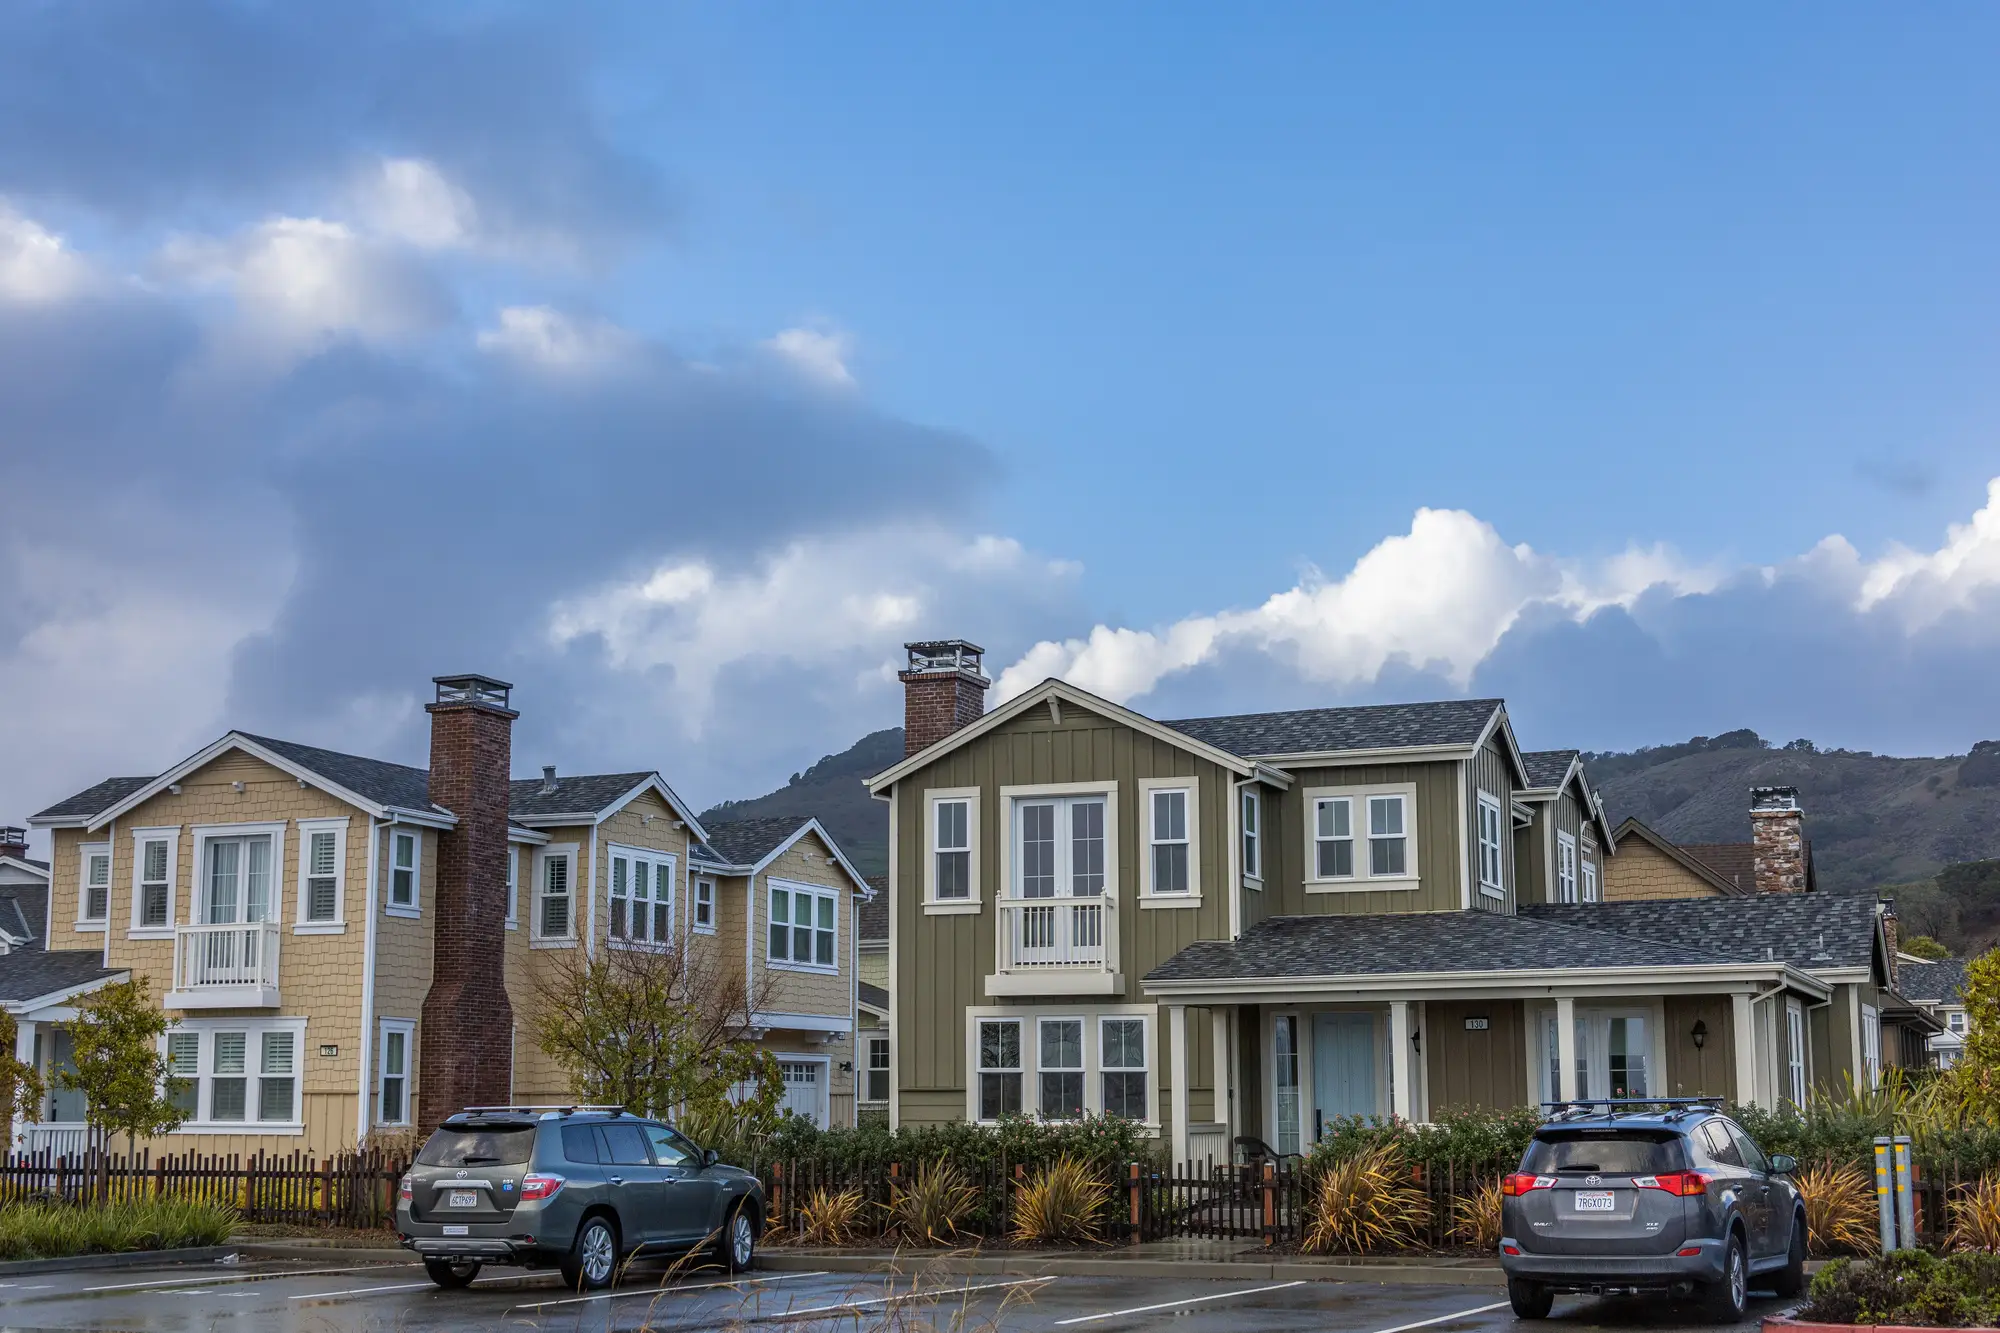
When the assessor file doesn't cover your trade area, you can't just wait for it to catch up. New subdivisions get built faster than county GIS departments update parcel boundaries, a lot of exurban and unincorporated land has thin or inconsistent tax records to begin with, and if you're scoping anything outside the US, parcel-level data might not exist in a usable format at all. None of that stops the pro forma from being due Friday.
So the question becomes practical: how do you put a number on rooftop count in a half-mile or one-mile ring around a candidate site when the parcel layer is missing, stale, or just wrong?
Why parcel data runs out before your trade area does
Parcel files are built for tax assessment, not retail site selection. They get updated on whatever cycle the county budget allows, which in a lot of fast-growth metro fringe areas means a new phase of 200 homes won't show up in the GIS layer for a year or more after residents move in. Rural counties often skip finer subdivision entirely. And plenty of markets, especially outside North America, never had a parcel-data tradition to begin with.
Analysts patch around this with secondary sources: Census block data at a geography that doesn't match your draw area, mobile location panels that tell you footfall but not housing stock, or a windshield survey if someone's willing to drive it. Each of those is usable, but none of them answers the specific question a site committee asks: how many housing units sit inside this ring, and what kind are they.
Counting rooftops from imagery instead of a tax roll
High-resolution imagery doesn't care whether the county updated its parcel layer. A current image of the trade area shows what's actually built: single-family detached, townhome rows, garden-style multifamily, the half-finished subdivision still under construction. Reading that imagery gives you a rooftop count that reflects what's on the ground today, not what was recorded two assessment cycles ago.
This is a built-form read, not a demographic model. You're not estimating income or spend; you're characterizing housing type, density, and land use mix as a physical proxy for retail demand. A ring with 1,400 detached rooftops on quarter-acre lots is a different trade area than one with 1,400 units packed into three garden-apartment complexes, even if a demographic overlay reports similar population counts for both. Housing type and density tell you something about trip frequency, basket size, and format fit that population alone doesn't.
The trade-off is real: imagery-based counts don't give you ownership records, assessed value, or parcel boundaries. If your next step is a title search or an acquisition package, you still need the parcel data eventually. But for the earlier question, how much rooftop demand is physically sitting around this candidate site, imagery answers it without waiting on a county office.
What a rooftop count tells you about demand
A raw rooftop number by itself is a start, not an answer. What matters for site selection is the mix: what share of the ring is single-family versus multifamily, how dense the multifamily product is, and how much of the land is still vacant or under construction and likely to add rooftops in the next build cycle. That mix is what turns a rooftop count into something closer to a retail demand proxy, because format fit depends on density as much as raw count.
This is the kind of read Trade Area Profiling was built to deliver: a numbered brief per candidate site, built from current high-res imagery, breaking out housing type mix, density, and land use for the ring you specify, produced on request rather than on a quarterly refresh schedule.
If the parcel file for your next candidate site is thin, out of date, or just doesn't exist, that's a reasonable place to start instead.