Blog·
Field notes: when the drive-time ring lied about what was built
We've all got one of these in the file. The site that penciled out beautiful on paper and then fell apart the second you got out of the car.
Mine was a pad on a four-lane arterial outside a mid-size metro, maybe eighteen months ago. Ten-minute drive-time captured a population number that made the regional team sit up. Median income cleared the threshold. The traffic counts were solid, nothing spectacular but solid. Every number on the summary sheet said go look harder, this one's real.
So I drove it. And what I found on the ground didn't match what the drive-time ring was telling me, because the ring doesn't know what it's drawing around.
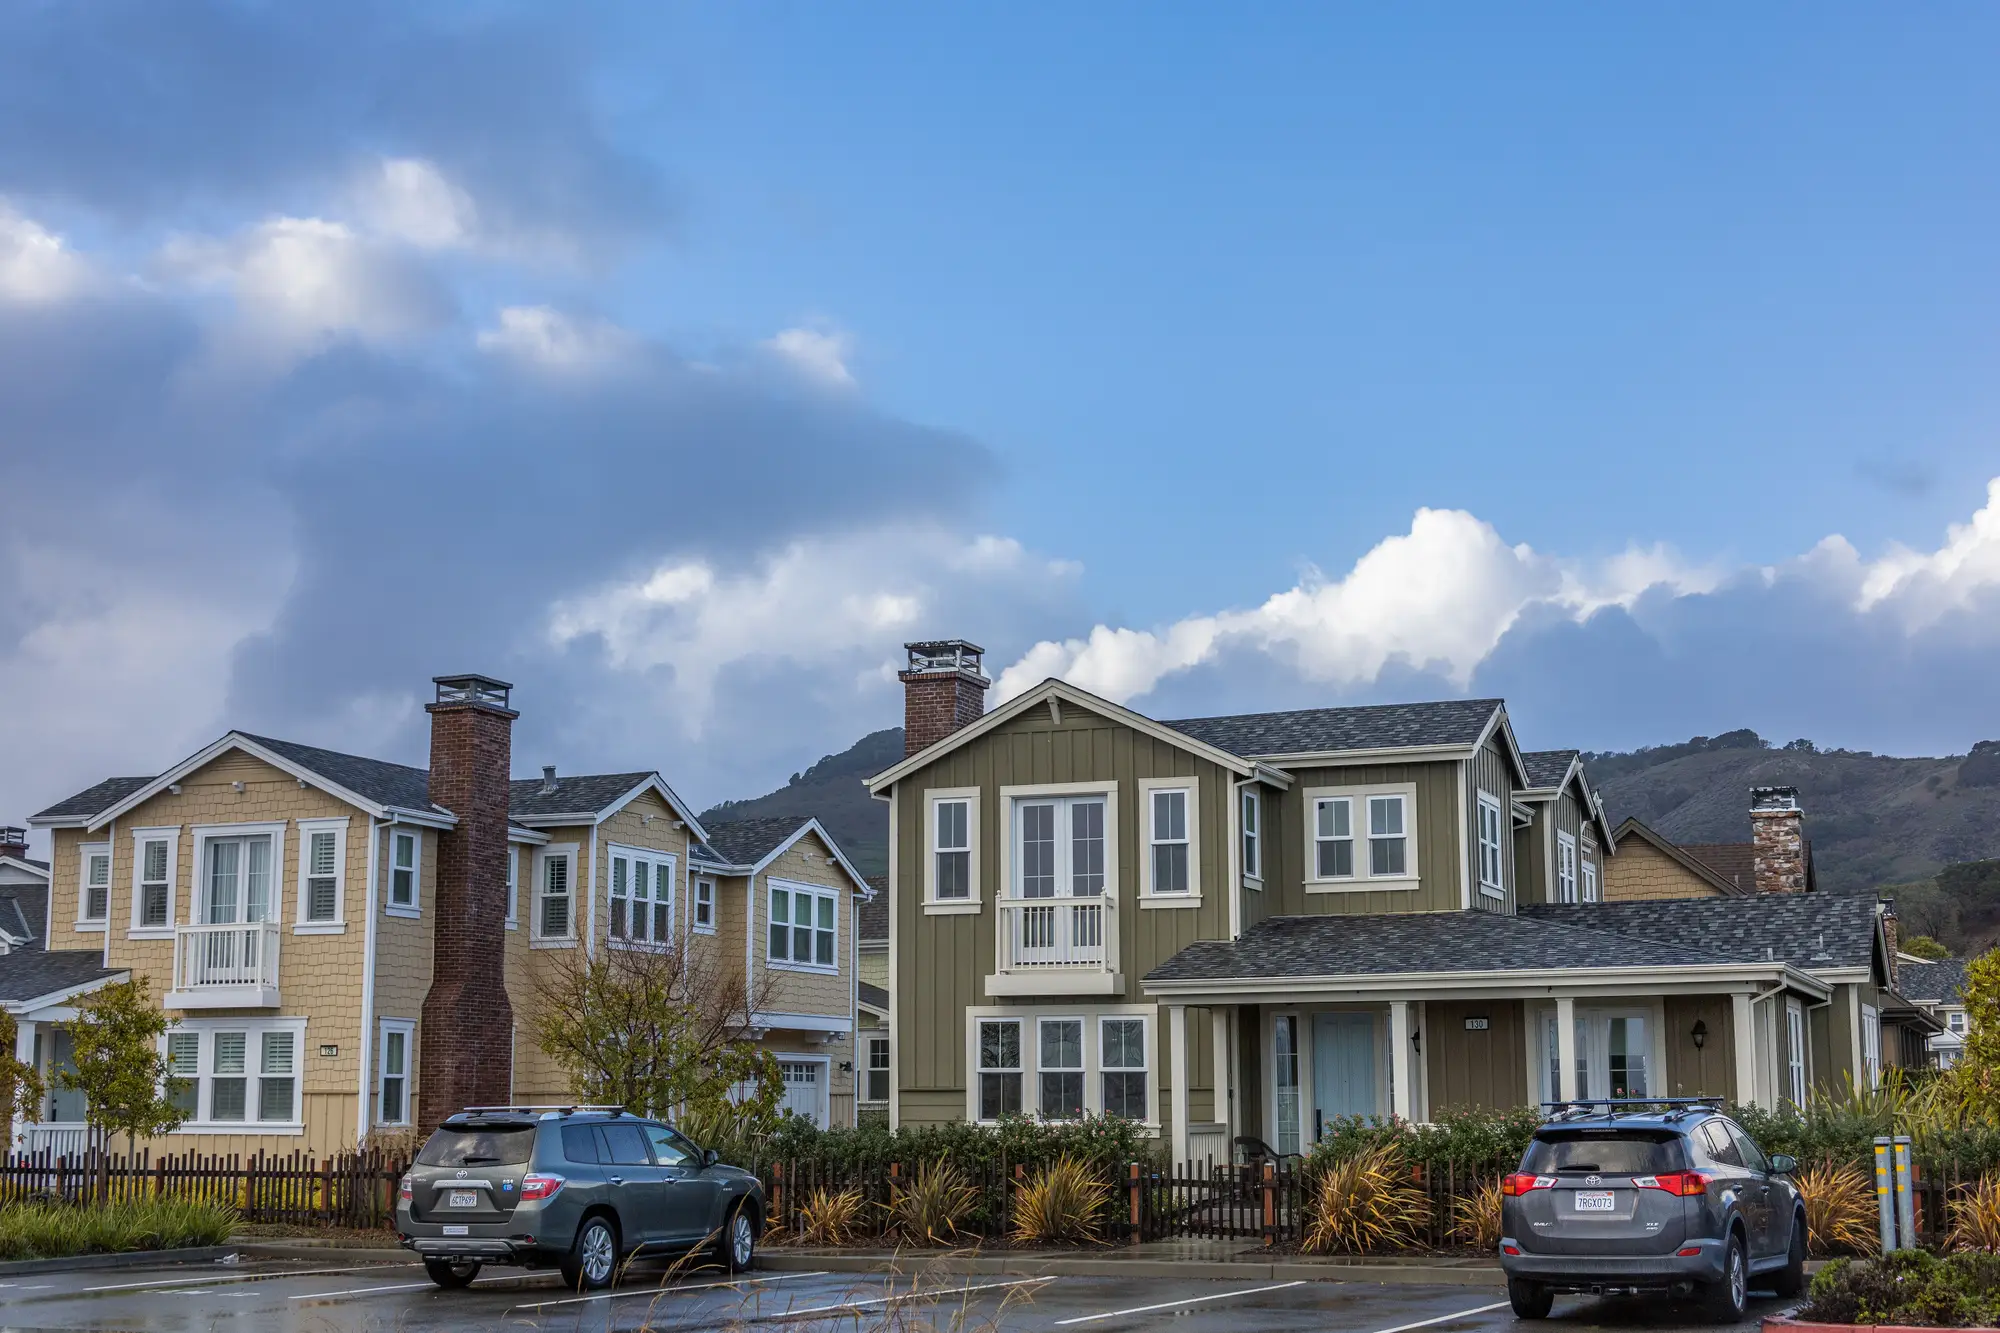
A big chunk of that ten-minute polygon was a single-family subdivision built in the early 2000s, decent rooftops, fine. But another third of it was garden apartments, the kind built at 12 to 15 units an acre, low-slung, lots of surface parking, high turnover. Nothing wrong with that as a demand base. It's just a completely different shopper than the subdivision, different basket size, different trip frequency, different sensitivity to price point. The drive-time model treats both as population. It doesn't know one is owner-occupied rooftops with two cars in the driveway and the other is a renter population that turns over every two years and shops differently because of it.
Then there was the part of the ring nobody had flagged at all: a quarter-section of land platted for houses a decade ago that had just sat there. Weeds, a stub road, a sign for a development that never happened. On the demographic overlay that acreage reads as part of the trade area. On the ground it's zero rooftops and zero demand, and it was eating almost 15% of the polygon's area. The population number counted a trade area that didn't exist yet, and might not for years.
This is the thing about drive-time rings that took me longer than I'd like to admit to really internalize: they're a transportation model wearing a demographics costume. They tell you who can reach the site in X minutes assuming the roads behave. They say nothing about what's been built on the land inside that ring, what kind of rooftops, how dense, whether it's single-family or multifamily or vacant pasture waiting on a developer who may never show. You're buying the Census tract's promise, not the parcel's reality.
The fix we'd always used was the windshield survey. Somebody drives the ring, takes notes, eyeballs the housing stock, guesses at density from the street. It works, and it's also a full day gone and entirely dependent on who you send and how good their eye is. Send someone new and you get a different read on the same ring.
What's changed the math for us lately is treating that windshield pass as something you can do from high-res imagery instead of a tank of gas. Pull recent overhead imagery for the candidate ring and you can characterize what's built there: housing type mix, density, where the vacant platted land sits versus where the rooftops actually are. It's the same question the windshield survey was answering, just without waiting for someone's calendar to clear. We started running candidate sites through a reading of the built environment around the point, not just the population inside it before committing drive time to the file, and it's caught two more "great numbers, wrong ground" sites since that pad.
The pad above didn't die. We resized the trade area to match what was built and backed the anchor away from the rooftops that weren't there yet. It's a fine site now. It just isn't the site the drive-time ring said it was.
If a candidate's numbers look too good before you've seen the pavement, that's usually the moment to check what Trade Area Profiling would tell you about the ground underneath them.